
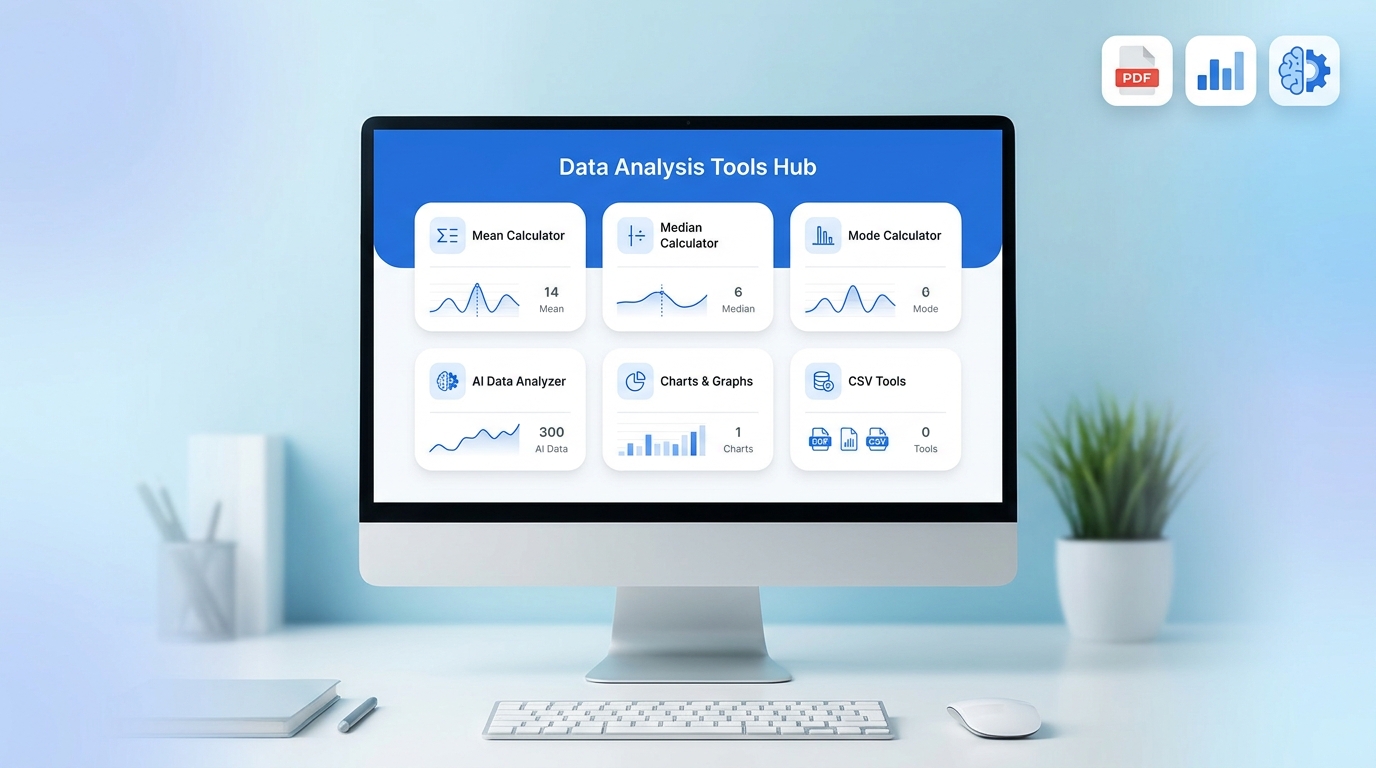
📊 Data Analysis Tools Hub PRO MAX
Fast, free & powerful statistical analysis tools
📘 How to Use This Platform
1. Click any Open button to start a tool.
2. The tool will automatically scroll into view.
3. Enter values in comma-separated format.
4. Click the action button (Calculate / Analyze).
5. View your result instantly below.
✔ Example: 10,20,30,40
✔ No installation required
✔ Works in browser
Mean
Median
Mode
Range
Sum
Std Dev
AI Analyzer
CSV Tool
Correlation
Chart
Mean Calculator
Example: 10,20,30,40
Click Calculate to get mean value.
Median Calculator
Mode Calculator
Range Calculator
Sum Calculator
Standard Deviation
AI Analyzer
CSV Analyzer
Correlation Calculator
Chart Generator
Welcome to the Data Analysis Tools Hub PRO MAX, a free online toolset that helps you calculate, analyze, and understand data in seconds. This platform is designed for students, teachers, researchers, and anyone who works with numbers.
It includes simple statistical tools, AI-style analysis, and instant PDF report download — all in one page, without installation.
🔍 What is Data Analysis?
Data analysis means:
- Collecting data (numbers or values)
- Understanding patterns
- Finding useful results
For example:
If you have numbers like:
10, 20, 30, 40
you can quickly find average, middle value, most repeated number, and more using this tool.
🚀 Why Use This Tools Hub?
This tool is useful because:
✔ No installation required
✔ Free to use
✔ Fast calculations
✔ Beginner-friendly
✔ Works on mobile and desktop
✔ Instant PDF report download
✔ Clean and simple interface
📊 Tools Overview (Full Explanation + Guide)
1. Mean Calculator (Average Tool)
📌 What it does:
Mean calculator finds the average value of numbers.
📘 How to use:
- Enter numbers separated by commas
- Example:
10,20,30,40 - Click “Calculate”
- You will get the average result
📌 Example:
Input: 10, 20, 30
Output: 20
🎯 Use case:
- Exam scores average
- Business data analysis
- Daily calculations
2. Median Calculator
📌 What it does:
Median finds the middle value after sorting numbers.
📘 How to use:
- Enter numbers
- Click calculate
- Tool automatically sorts data
- Shows middle value
📌 Example:
Input: 10, 50, 20
Sorted: 10, 20, 50
Median: 20
🎯 Use case:
- Salary analysis
- Real estate prices
- Balanced data check
3. Mode Calculator
📌 What it does:
Mode finds the most repeated number in data.
📘 How to use:
- Enter numbers
- Click calculate
- Tool shows most frequent value
📌 Example:
Input: 10, 20, 20, 30
Output: 20
🎯 Use case:
- Market trends
- Survey results
- Most common values
4. AI Analyzer Tool
📌 What it does:
This tool gives basic AI-style insight about data trends.
📘 How to use:
- Enter numbers
- Click analyze
- Tool shows average and trend
📌 Example:
Input: 10, 20, 30, 40
Output:
- Average value
- Trend (up or stable)
🎯 Use case:
- Quick data understanding
- Business insights
- Study projects
5. Range Calculator
📌 What it does:
Range shows the difference between highest and lowest value.
📘 How to use:
- Enter numbers
- Click calculate
- Result = Max − Min
📌 Example:
Input: 10, 50, 100
Range: 90
6. Sum Calculator
📌 What it does:
Adds all numbers together.
📘 How to use:
- Enter values
- Click calculate
- Get total sum
📌 Example:
10 + 20 + 30 = 60
7. Standard Deviation Tool
📌 What it does:
Shows how much data is spread out.
📘 How to use:
- Enter numbers
- Click calculate
- Get deviation result
🎯 Use case:
- Finance analysis
- Data science
- Research studies
8. CSV Analyzer Tool
📌 What it does:
Counts rows of CSV data.
📘 How to use:
- Paste CSV data
- Click analyze
- Get number of rows
🎯 Use case:
- Excel data check
- Data cleaning
9. Correlation Calculator
📌 What it does:
Shows relationship between two datasets.
📘 How to use:
- Enter X values
- Enter Y values
- Click calculate
📌 Example:
If X increases and Y also increases → strong positive correlation
10. Chart Generator
📌 What it does:
Creates simple bar-style visualization.
📘 How to use:
- Enter numbers
- Click draw
- See visual chart
🎯 Use case:
- Quick data visualization
- Reports
- Presentations
📥 PDF Report Feature (Very Important)
This tool includes a PDF download option.
📘 How it works:
- Run any tool
- Click “Download PDF”
- Report will download instantly
📌 What is inside PDF:
- Input data
- Result
- Tool name
🎯 Use case:
- School assignments
- Business reports
- Documentation
- data analysis tools online
- statistics calculator free
- mean median mode calculator
- data analysis tools hub
- AI data analyzer tool
- CSV analyzer online
- correlation calculator free
- PDF report generator tool
- online math tools free
- data visualization tool
🎯 Final Conclusion
The Data Analysis Tools Hub PRO MAX is a complete online toolkit for anyone who wants to:
- Analyze data quickly
- Understand statistics easily
- Generate reports instantly
- Save results in PDF format
It is simple, fast, and perfect for beginners and professionals.
❓ Frequently Asked Questions (FAQs)
1. What is Data Analysis Tools Hub?
It is a free online platform that helps you calculate and analyze data using tools like mean, median, mode, charts, and more.
2. Is this tool free to use?
Yes, all tools are 100% free and work directly in your browser.
3. Do I need to install any software?
No installation is required. You can use it directly online.
4. Can I download results as PDF?
Yes, every tool has a PDF download option to save your report instantly.
5. Who can use this tool?
Students, teachers, researchers, and business users can use it easily.
6. Is my data saved?
No, all calculations are done in your browser. Nothing is stored.